Naviloq Release Notes 2026
This page serves as the home for Naviloq’s major release notes, giving you clear visibility into how Naviloq evolves over time and how new features create real business value for you. They help you stay informed, adopt new capabilities with confidence, and understand how each release fits into our long‑term product vision.
We typically deliver 2–3 major releases per year, each introducing new features and functionality designed to improve analysis, reporting, and decision‑making. For every major release, we’ll publish a detailed release note here highlighting what’s new and why it matters.
If you’re interested in earlier release notes, please don’t hesitate to reach out, we’re happy to share them directly.

Naviloq Version 8, Released 04/2026
Naviloq Version 8 introduces a major step forward in analytics with the launch of the Naviloq AI Controller. This new capability brings AI‑driven financial analysis directly into the platform, automatically turning dashboard data and KPIs into clear insights for business users.
In addition to AI‑powered analysis, this release includes improvements to drilldown functionality, dataset time filtering, usability enhancements, and several stability fixes.
Naviloq AI Controller
The Naviloq AI Controller is an AI‑powered financial analysis and reporting assistant embedded within the Naviloq platform. It analyzes visualizations, financial metrics, and operational data to transform complex dashboards into clear, actionable insights.
Instead of manually reviewing multiple visualizations and preparing commentary, users can generate automated explanations of trends, anomalies, and performance drivers directly from their visualizations.
Key features of Naviloq’s AI controller
AI-powered visualisation analysis
Generate AI analysis directly from dashboard visualizations
Translate visualizations and KPIs into clear plain-language explanations
Quickly understand the meaning behind complex financial data
Performance insights
Detect trends, anomalies, and opportunities in financial and operational data
Provide faster visibility into performance changes across the business
Narrative business analysis
AI generates structured explanations linking KPIs, drivers, and outcomes
Helps stakeholders understand what is happening and why it matters
Analysis sharing and collaboration
AI analysis can be shared within Naviloq chat groups
Teams can collaborate around generated insights
Designed for Modern Finance Teams
The AI Controller helps:
Finance teams automate financial analysis and reporting commentary
CFOs and controllers gain faster visibility into performance drivers
Management teams receive clear, data-driven insights for decision making
The feature represents the first step toward a broader AI-driven analytics experience in Naviloq.
Coming in future releases
Executive-ready performance summaries
Scheduled automated analyses
AI-generated presentation materials
Conversational finance assistant for natural-language questions
Note: Use of the AI Controller is subject to our Acceptable Use Policy. Please review the policy to ensure responsible and compliant use of AI-powered features.
New Features in Naviloq Version 8
AI Controller
AI analysis generation for dashboard visualizations
AI analysis history per visualization
Ability to share AI analyses through Naviloq chat groups
User feedback system for AI responses
Visualisation snapshots included in AI analysis
Enhanced Linked Drilldowns
New linked drilldown reporting capability where users can attach multiple visualizations as drilldown visualizations
Ability to attach multiple analyses as drilldown visualizations
Drilldown navigation via bottom panel view
Improved drilldown management
Dataset Time Restriction Enhancements
Expanded dataset time restriction options to support more advanced reporting scenarios
Introduced new time. restriction options enabling more flexible reporting through calculated measures
Improvements
Improvements to cascading filter behaviour
Dependency updates and stricter version management for improved security
Infrastructure and configuration improvements to support platform stability
Improvements to API documentation and monitoring capabilities
In addition, Naviloq version 8 includes numerous UI improvements, performance optimisations, stability enhancements, and bug fixes.
Naviloq Version 7, Released 02/2026
A Step Toward Naviloq’s AI Controller
All the enhancements included in this release build toward a larger vision: Naviloq’s AI Controller, which will be introduced later this year. Naviloq’s embedded AI Controller will act as a tireless analyst scanning dashboards, surfacing trends, anomalies, and opportunities.
The features in Version 7 lay important groundwork by improving usability, analytical depth, automation, and executive‑level reporting, which are all key capabilities that will power the next generation of intelligent, AI‑assisted financial and operational control in Naviloq.
Below, you’ll find the full release note of Naviloq Version 7.
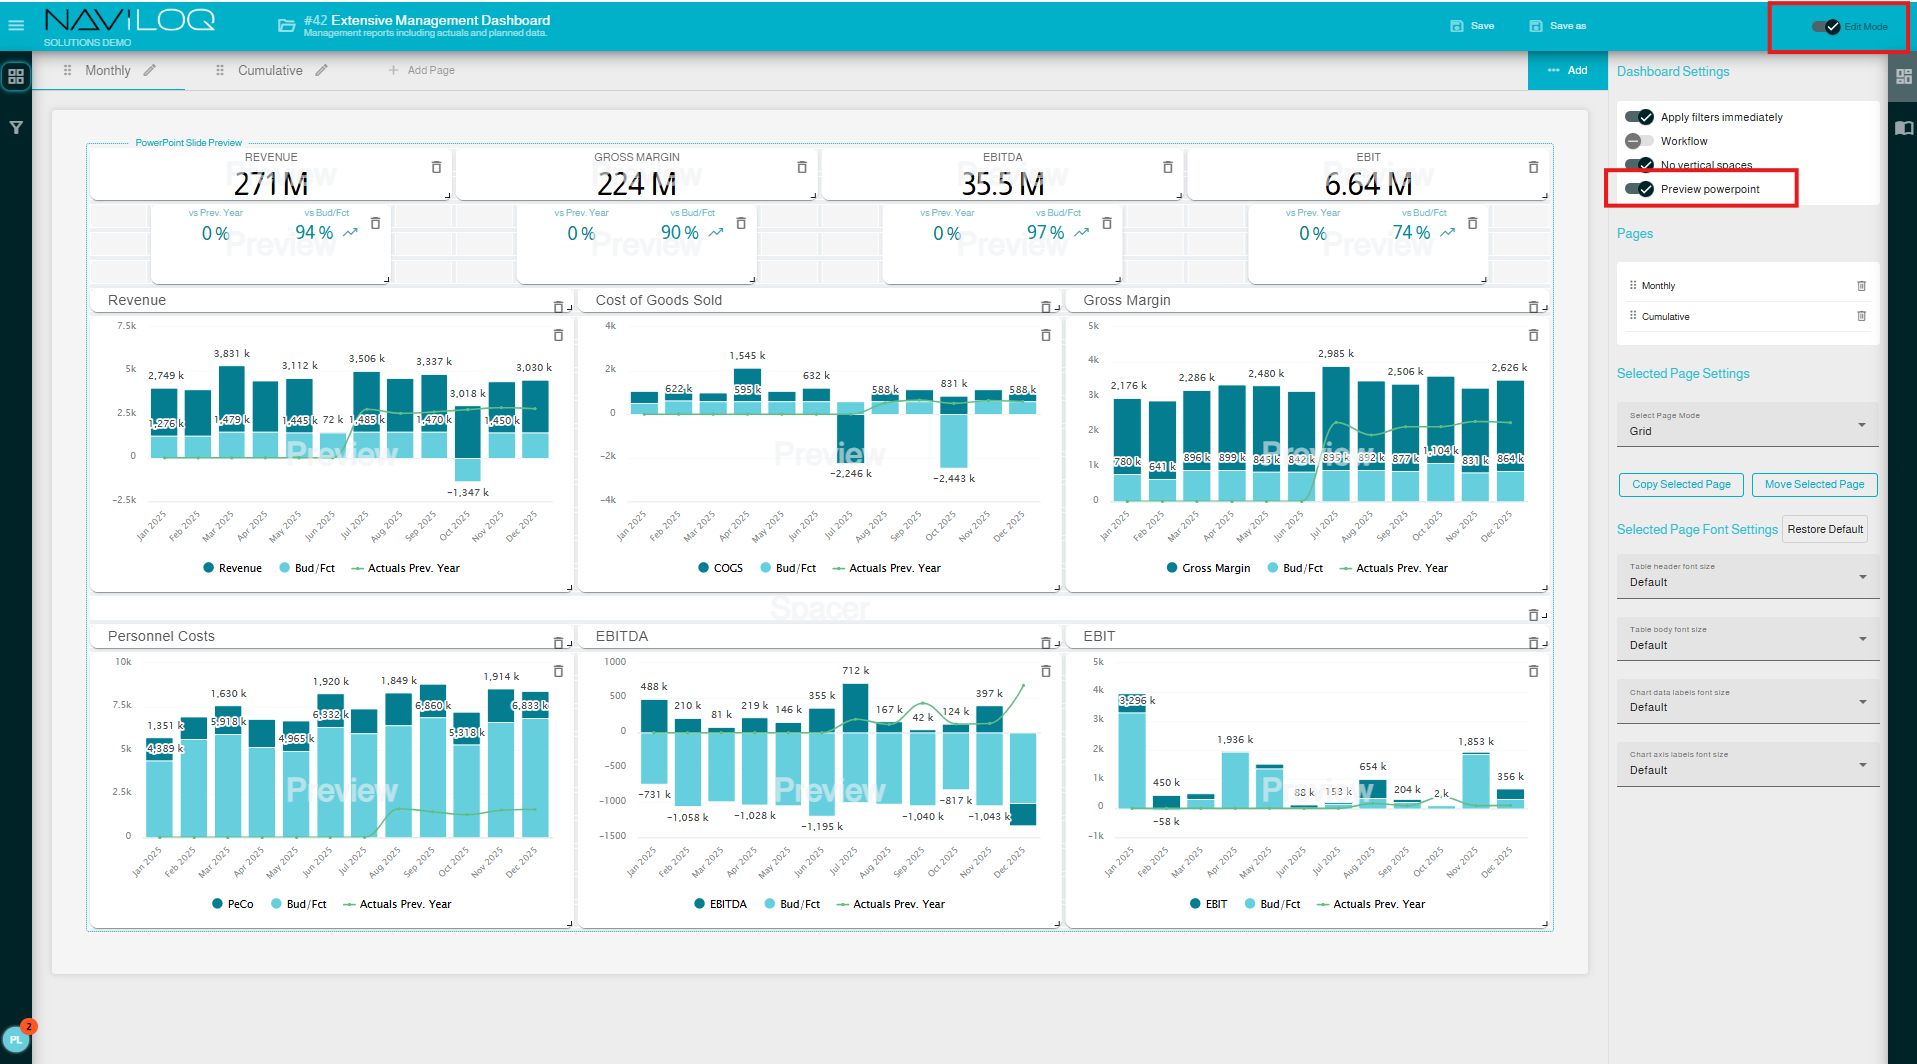
PowerPoint Export Built for Executive Reporting
Creating management and board reports just became dramatically easier.
Dashboards and visualizations can now be exported directly to PowerPoint, removing the need for manual slide building and screenshot juggling. Scheduled exports ensure your slide decks are automatically prepared and distributed to recipients on time.
Best practice tip:
For optimal results, we recommend designing purpose-built dashboards for PPT exports. Naviloq’s dashboard page designer now includes a PowerPoint preview mode, making it easy to see which elements fit perfectly onto slides.
A true game changer for executive-level reporting.
Improved Fonts & Readability
Visual clarity matters especially in management meetings.
Version 7 introduces enhanced font styles, sizing options, and contrast, making data labels easier to read for everyone, from the front row to the very back of the room.
Global settings can also be changed in order to set default font settings (General Settings → Visualization Settings → Font Settings).
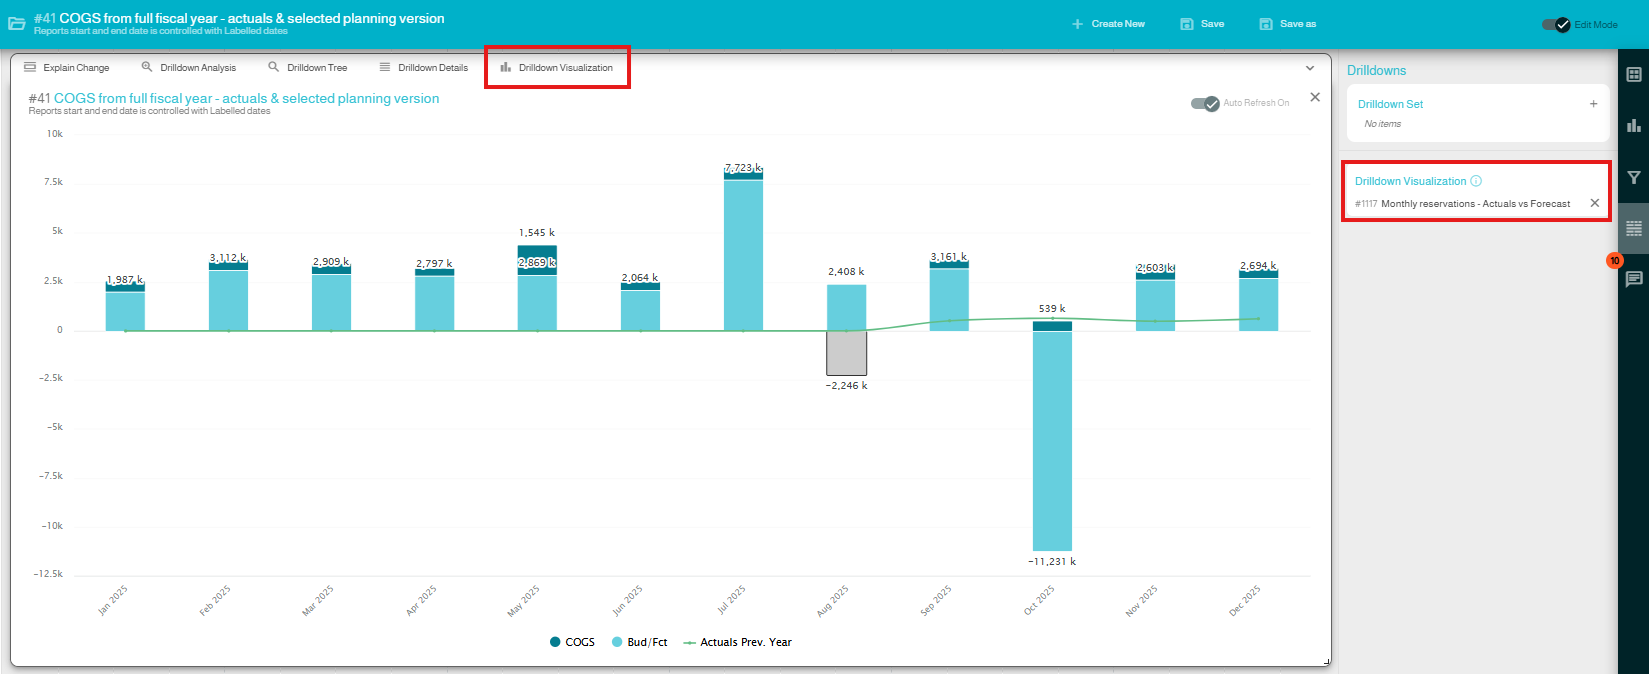
Linked Drilldown Paths For Real Root Cause Analysis
Content creators can now configure custom drilldown paths that guide users through meaningful analysis flows with no limitations on data models.
Example:
· Start from a Profit & Loss view
· Detect a deviation
· Drill directly into operational data to uncover the root cause
And this is just the beginning, future releases will allow:
· Multiple drilldown destinations paths per visualization
· Users will be able to store their own personalized analysis paths, beyond what content creators have defined
This opens the door to truly personalized, dynamic analytics.
This is how the Drilldown Visualization can be attached:
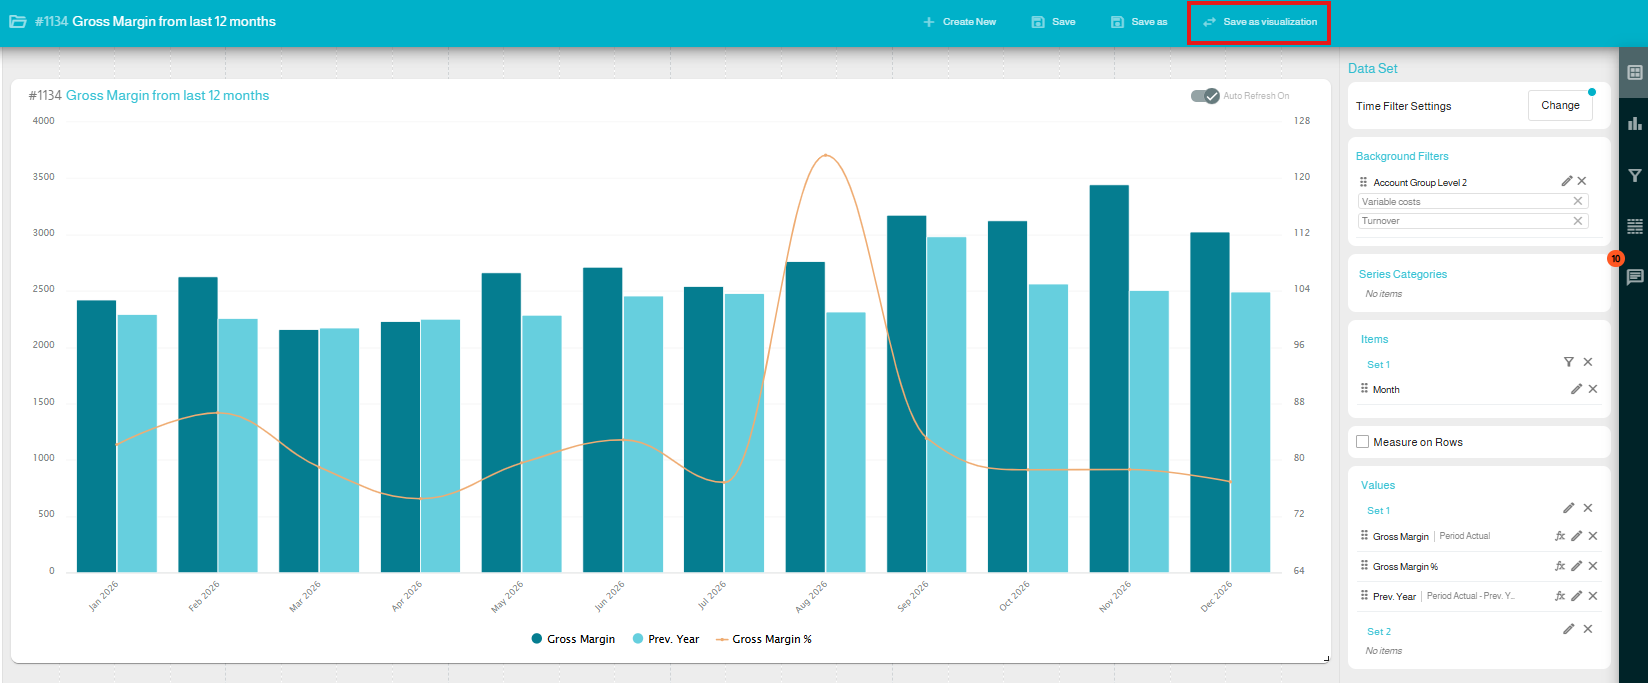
Save Your Analyses as Visualizations
Created a killer personal analysis that others should see?
You can now convert your personal analysis directly into a visualization and add it to dashboards. No need to rebuild it from scratch.
Calendar Date Range Filtering
Naviloq now supports a visual calendar-based date range filter, allowing users to select reporting periods in a more intuitive way.
Importantly, this is fully configurable, you can choose whether to use the traditional filtering approach or the new date range picker, depending on preference and use case.
Copy & Move Dashboard Pages
A long-awaited‑ productivity boost. You can now copy or move dashboard pages between dashboards, making it easy to:
· Reuse existing dashboards with small modifications
· Create tailored versions for different user groups or access rights
· Build PowerPoint optimized dashboard pages without starting from scratch
Cascading Filter Values
Cascading Filter Values enhance the dashboard filtering experience in Naviloq by ensuring that filter selections dynamically update related filter options based on the underlying data.
Improved Upgrade Recommendations
We have improved in-app subscription notifications and users will receive more informative messages when attempting to access features outside their current subscription, helping them easily understand upgrade options.
Query Cancellation
Background queries are now automatically cancelled when the user navigates away, ensuring better resources handling and performance of the overall system.
Enhanced Notification System
Pagination, filtering, and improved search for notifications, including support for viewing older and read notifications.
Chart Data Label Design Schemes
Users can now choose how they want their chart data label design/scheme for visualizations from three options. Default (Current), Light and Dark.
In addition, Naviloq version 7 includes numerous UI improvements, performance optimizations, stability enhancements, and bug fixes.